Description
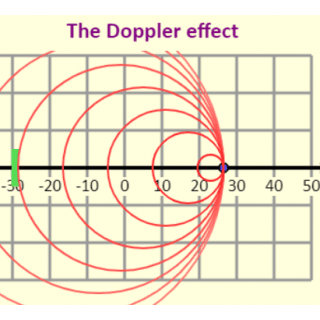
This is a simulation of the Doppler effect. You can set both the initial position and the velocity of the source (the small blue dot). and the initial position and the velocity of the observer (green rectangle), and then see the pattern of waves emitted by the source as the waves wash over the observer. The source emits a frequency of 100 Hz when the source is at rest. fo represents the observed frequency (the one heard by the observer).
View and write the comments
No one has commented it yet.